The Steel Tongue Drum is a recently invented musical instrument that consists of a curved and cutted steel plate. The instrument is mainly handcrafted, so by the time of this research there wasn’t any study on its acoustic properties. For this reason, the idea of my bachelor thesis was to propose a scientific approach on designing this instrument.

The first step was to understand which mechanical characteristics determines the acoustic response. The null hypothesis was that the main factor that contributes to its acoustic response is the metallic structure’s modes of vibration. Therefore, I scanned the musical instrument using the software Autodesk ReCap, that gathers photos from different angles and makes a 3d mesh out of it.

| 
|
After scaling the mesh to the appropriate dimensions (using the rule placed at the table), the mesh was imported into a CAD software (PTC Creo), and a parametric model was drawn following the mesh geometry.

| 
|
The mechanical process used to conform the plate to its curved shape makes its thickness uneven, given by the sine of the shear angle.

| 
|
In order to consider that into our 3D model, we parameterize the thickness based on the normal angle of the surface, giving the following thickness curve.


The next step is to run a modal analysis, so I imported the parametric model into the software Ansys Workbench and applied a fixed constraint in the contact point of the instrument with the ground. I also refined the mesh around the edges of each tongue.

| 
|
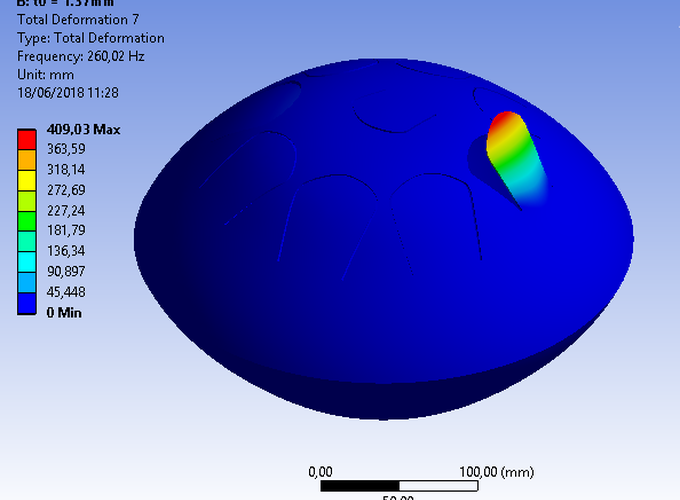
The result of the modal simulation is the shape of each mode and its corresponding frequency. One can observe that the first 2 modes are related to the “free body” modes, therefore are ignored in our analysis.

The modes that have significantly more displacement on specific tongues indicates that when hitting that tongue, that frequency will be excited. In that manner, we can associate that frequency with the underlying tongue, giving us a summary table relating each tongue to a specific frequency.

With the results of the simulation in hands, it’s time to perform an acoustic test on an anechoic chamber. The base of the instrument was excited with a mechanical actuator, and the microphone placed above the instrument recorded the response.

| 
| 
|
The input was a logarithmic Sine Sweep from 100Hz to 1000Hz that took an hour long to complete. The result can be then plotted as a Bode Diagram showing the Frequency response Mic/Force.

The peak frequencies were then compared with the frequencies found in the modal simulation, resulting in the comparison chart below.

As the curves look almost exactly the same, one can cannot discard the null hypothesis, indicating that the viscous interaction with the fluid is indeed negligible, and the only relevant characteristics were the geometry and material of the instrument. Therefore, the frequencies of each note of the instrument can be approximated by a simple modal analysis, enabling one to design new instruments with desired notes. You can take a look at the full report (in portuguese) for more details.

